
Diamond News Archives
- Category: News Archives
- Hits: 1196
 (IDEX Online) – Carats.io has announced that it has appointed former Israel Diamond Exchange and Israel Diamond Institute Managing Director Eli Avidar as president. <?xml:namespace prefix = "o" ns = "urn:schemas-microsoft-com:office:office" /?> Carats.io is an Israeli startup issuing the first cryptocurrency backed by diamonds, thereby establishing the first-ever financial market for diamonds. The company uses state-of-the-art Big Data and blockchain technologies to tokenize diamonds, and has created an algorithm that compares individual diamond grades to daily market conditions. This algorithm has so far been deployed to price over $10 billion worth of diamonds. The company, which is audited by international accounting firm Ernst & Young, raised $1.6 million in its first financing round. "The international financial community is divided into those who are wary of digital currencies and those who are seeking a way to invest in them," said Avidar. "Regulators in the major markets are working intensely to find ways to integrate digital currencies into their trading systems. "Carats.io is based on principles of transparency, stability and liquidity, which serves it well in complying with the demands of international regulations in areas of capital markets, anti-money laundering and Basel Committee standards. The company was established to be a bridgehead between the very traditional diamond market and the new financial world," he added. Avidar, who is currently vice president of CIBJO, The World Jewellery Confederation, held a number of top level positions with the Israel Foreign Ministry and served in several postings abroad before joining the diamond industry more than a decade ago. ...
- Category: News Archives
- Hits: 1103
The Minerals Council South Africa, an industry lobby group, said on Sunday it does not support some elements in the latest draft of an industry charter, including a stipulation that one percent of core profit is paid to communities and employees.
South Africa plans to raise black ownership at permit-holding mining companies to 30 percent from 26 percent within five years, the draft showed on Friday.
But the Minerals Council, whose members include mining companies, said in a statement that the raised target was never agreed as a recommendation and is a surprise inclusion.
"The Minerals Council does not support this top up, as it prejudices existing rights holders that secured their rights on the basis of the 2004 and 2010 Charters," it said.
The new draft charter extends to five years from one year the time that existing mining permit holders will have to meet the new black ownership requirement.
Other proposals in the charter include: new mining rights holders must pay one percent of core profit, or EBITDA, to employees and communities in circumstances where a dividend is not declared in any 12 month period.
This also, according to the lobby group, is a surprise addition and was not agreed upon as a recommendation.
On Friday it said it was against a requirement that 10 percent (a third of the 30 percent black ownership target) for new mining right applicants be granted for free to communities and qualifying employees, dubbed "free carry".
The government and miners had been at loggerheads over a previous version of the charter, which the Chamber of Mines industry body, now Minerals Council, slammed as confusing and a threat to South Africa's image with investors.
"The Minerals Council believes that much...
- Category: News Archives
- Hits: 1333
Gold softened overnight in a range of $1297.50 - $1303.20, tripping some sell stops under the $1300-$1303 former resistance level (7 tops 6/1, 6/5,6/6, 6/7, 6/8, 6/11, and 6/12 highs, $1300 – down trendline from 5/15 $1315 top, 50% retracement of up move from 12/12/17 $1236 low to 1/25/18 $1366 high, $1300 – psychological level, options).
It was pressured by a firmer dollar (DX to 95.14, fresh 7-month high), which was helped by weakness in the yen (110.45-110.90, BoJ had dovish assessment of inflation, no hurry to scale back stimulus), and continued weakness in the euro ($1.1543 – fresh 2-week low, ECB’s decision yesterday to keep rates low through next summer still resonating).
Mostly weaker global equities were gold supportive with the NIKKEI up 0.5%, the SCI was off 0.7%, European markets ranged from unch to -0.8%, and S&P futures were -0.5%.
An official statement from the Trump Administration announcing 25% tariffs on a list of $34B of Chinese goods and a statement from China threatening retaliation weighed on stocks, and helped take the US 10-year bond yield down to 2.19%, it but failed to stem gold’s decline.
Selling on the NY open knocked gold down to support at $1294 (up trendline from 12/15/16 $1123 low). This was followed quickly by a stronger than expected reading on the Empire State Manufacturing Index (25 vs. exp. 18.5) that brought the DX back up to 94.89, and broke gold’s support at $1294.
The yellow metal plunged through support at $1292-93 (double bottom – 6/12, and 6/13 lows) to reach $1288, where it found support at the double bottom low from 5/22-23. A fair amount of long liquidation was seen.
At 9:15 AM, worse than expected readings on US Industrial Production (-0.1% vs. exp. 0.2%)...
- Category: News Archives
- Hits: 1383
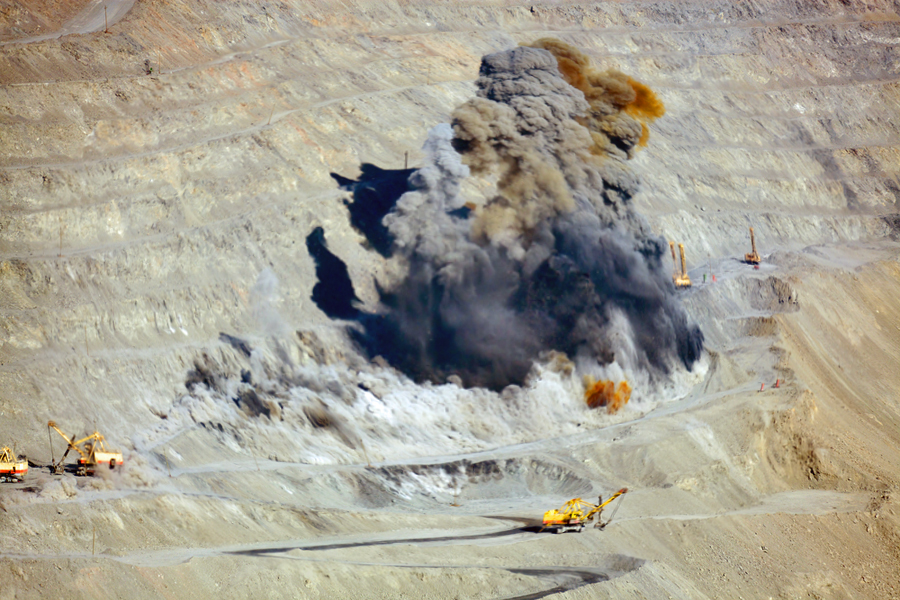
Big mining blasted
Mining and metals investors were offloading the sector's big names on Friday over fears of the impact of a trade war between the US and China, which is responsible for nearly half the world's industrial metal demand and two-thirds of the world's seaborne trade in steelmaking raw materials.
Copper fell nearly 3% to $3.13 a pound or $6,900 a tonne, pushing the bellwether metal back into the red for the year. Last week copper touched the highest levels since January 2014. The S&P GCSI Industrial Metals index also moved back into negative territory for 2018, despite a year-to-date rally in nickel of nearly 20% and stronger aluminum prices.
Friday's sell-off came after a busy week for mining's heavyweights with several big deals which appeared to signal that after years of belt-tightening, the majors are again looking for growth opportunities.
Shares in world number one miner BHP Billiton (NYSE:BHP) lost 4.5% in New York dropping the market valuation of the Melbourne-based company to $125 billion. Yesterday BHP approved construction of a $4.2 billion iron ore mine in Western Australia sparking talk of a new boom time in the Pilbara.
Several big deals this week appeared to signal that after years of belt-tightening, the majors are again looking for growth opportunities
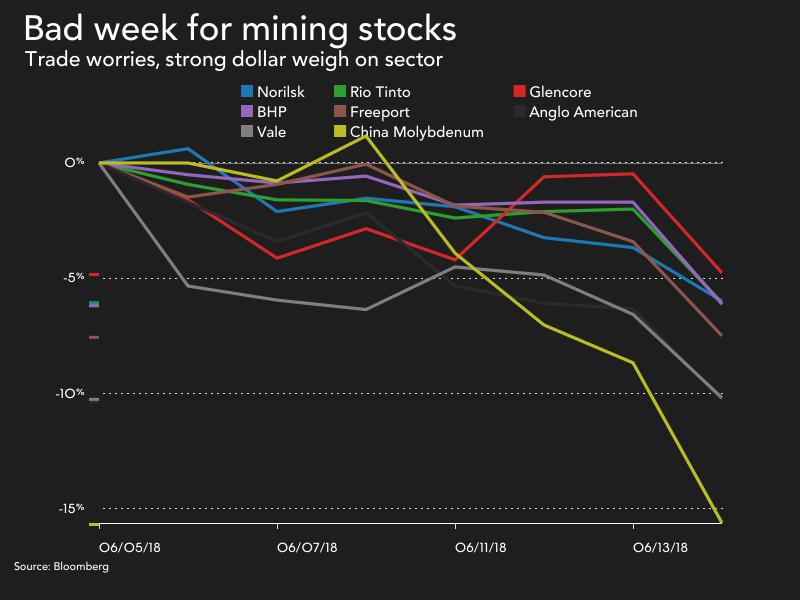 Vale (NYSE:VALE.P), the world's top iron ore and nickel producer, fell 5.6%. Rio de Janeiro-based Vale has been making the most of the rally in battery raw materials with the signing of a $700m cobalt streaming deal on its Canadian nickel mine earlier this week. Vale will use the money to fund a $1.7 billion underground expansion at Voisey's Bay, Labrador.
Anglo American (LON:AAL) gave up 4.3% in New York, bringing year to...
- Category: News Archives
- Hits: 1303
Certain areas of the world are more vulnerable to economic and societal collapse. While most analysts gauge the strength or weakness of an economy based on its outstanding debt or debt to GDP ratio, there is another factor that is a much better indicator. To understand which areas and regions in the world that will suffer a larger degree of collapse than others, we need to look at their energy dynamics.
For example, while the United States is still the largest oil consumer on the planet, it is no longer the number one oil importer. China surpassed the United States by importing a record 8.9 million barrels per day (mbd) in 2017. This data came from the recently released BP 2018 Statistical Review[1]. Each year, BP publishes a report that lists each countries’ energy production and consumption figures.
BP also lists the total oil production and consumption for each area (regions and continents). I took BP’s figures and calculated the Net Oil Exports for each area. As we can see, the Middle East has the highest amount of net oil exports with 22.3 million barrels per day in 2017:

The figures in the chart above are shown in “thousand barrels per day.” Russia and CIS (Commonwealth Independent States) came in second with 10 mbd of net oil exports followed by Africa with 4 mbd and Central and South America with 388,000 barrels per day. The areas with the negative figures are net oil importers.
The area in the world with the largest net oil imports was the Asia-Pacific region at 26.6 mbd followed by Europe with 11.4 mbd and North America (Canada, USA & Mexico) at 4.1 mbd.
Now, that we understand the energy dynamics shown in the...