
For data wonks like me, the annual Yearbooks from various gold and silver consultancies make for fun reading. You can always find little gems about what’s going on in the markets, and sometimes you can spot changes in trends early on. Seeing a compelling chart, especially one that’s not been widely reported, is almost as exciting as seeing my wife in a short skirt on date night.
Well, I’ve got a series of charts for you that point to a silver trend that is so entrenched in its development, so inevitable in its outcome, so inescapable in its consequences that it comes as close as one can get to a guarantee. And once fully underway, it will have major implications for the silver price, along with the availability of investment metal.
These charts all come courtesy of CPM Group’s 2018 Silver Yearbook. There are a number of precious metals consultancies in the industry, but I’ve found over the years that their Yearbooks[1] have the most comprehensive and in-depth research (I know many readers disagree with their views on manipulation of the metals, but separate that out from the data they’ve uncovered and what it means).
Let’s jump in, starting with the demand side…
Isn’t Silver Investment Demand Down?
What most investors hear is that silver demand is down. And yes, coin and bar sales fell 52% last year, ending up at approximately the same level as 2007. But demand for ETPs (exchange-traded products, including ETFs) remained near all-time highs, as the data shows.
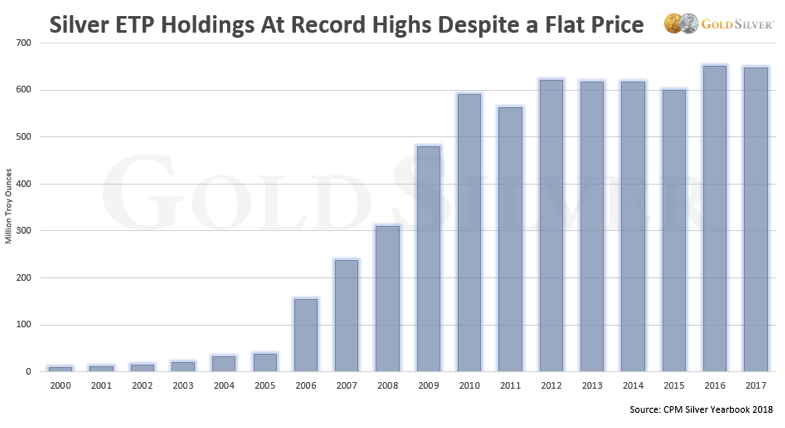
SLV and other silver paper vehicles saw virtually no drop in holdings last year, in spite of a weak silver price and falling physical demand. You and I don’t buy these products, but interest from...