
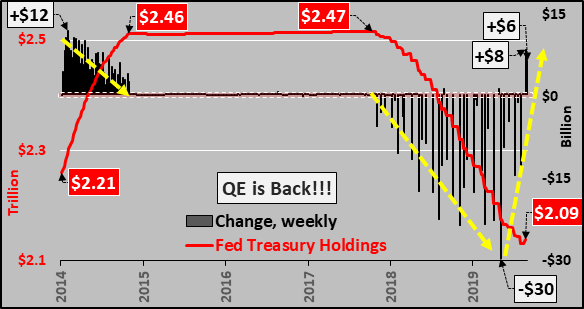
Chart below shows the Fed's total Treasury holdings (red line) versus the weekly change in Treasuries (black columns) since 2014. The QE taper is visible with the first dashed yellow line, the Quantitative Tightening and then the QT taper. The Fed has begun a new period of Treasury purchasing...but for how long, who knows.
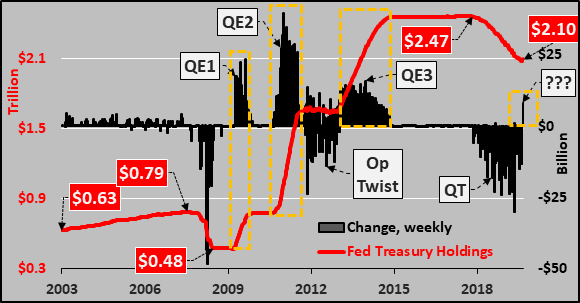
To put things in perspective, the chart below shows the Fed holdings of Treasuries (red line) and weekly change in Treasury buying (black columns) since 2003. Clearly visible is the activist role the Fed has taken since the GFC...QE1, QE2, Operation Twist, QE3, Quantitative Tightening...and now???
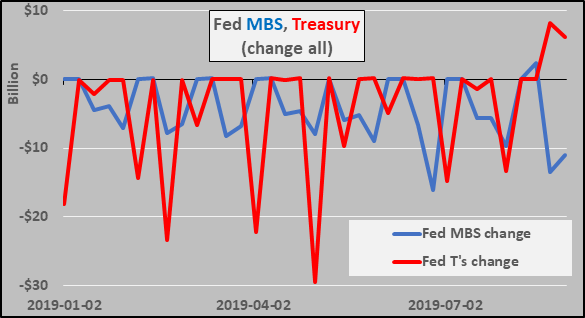
To highlight the changing nature of the Fed's balance sheet since the start of 2019, the chart below shows the weekly change in MBS (blue line), and change in Treasury holdings (red line). The Fed has suggested it will continue rolling off MBS in exchange for T's indefinitely...definitely worth watching.
And just to highlight the immediate and incredible impact of the Federal Reserve purchasing of Treasuries on equity prices, the chart below is weekly changes in Treasury purchases (yellow columns) versus...