
The albatross of $617 billion in bonds that mature in over 10 years.
Over the next few months, the Fed is expected to announce its new plan for its balance sheet. Meanwhile, as we’re riveted to the edge of our seat, the old plan continues on autopilot, and February was one of the few months when the Treasury “roll-off,” as Chairman Jerome Powell likes to call it, hit the “caps.”
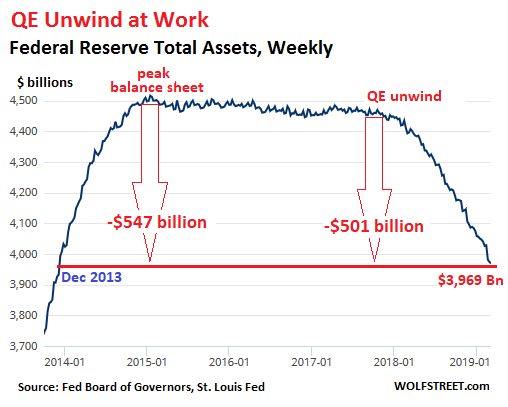
In February, the Fed shed $57 billion in assets, according to the Fed’s balance sheet for the week ended March 6[1], released this afternoon. This slashed the assets on its balance sheet to $3,969 billion, the lowest since December 2013. Via its “balance sheet normalization,” the Fed has now shed $501 billion. And since peak-balance-sheet at the end of 2014, the Fed has shed $547 billion:
During peak-balance-sheet at the end of 2014, total assets ($4.52 trillion) amounted to 26% of GDP. Today’s assets amount to 19.4% of GDP. In the years before QE started, the balance sheet ran around 6% of GDP.
By comparison, the ECB’s balance sheet assets now exceed 40% of GDP, and the Bank of Japan’s assets amount to 101% of GDP[2].
February’s drop of $57 billion is larger than the scheduled QE unwind that is capped at $50 billion. But the Fed has other activities that impact the balance sheet. QE revolved around Treasury securities and mortgage-backed securities (MBS). And so does the QE unwind.
According to the Fed’s plan revealed in 2017, the QE unwind is supposed to take place on automatic pilot, based on a formula by which the Fed is scheduled to shed “up to” $30 billion in Treasuries and “up to” $20 billion in MBS...